I am trying to create a clearer network from an interactome file of more than 600,000 entries using NetworkX and Matplotlib.
This is the code I’m running:
import networkx as nx
import matplotlib.pyplot as plt
from networkx.drawing.nx_agraph import graphviz_layout

ppi_file = r"F:\Python Project\PathLinker_2018_human-ppi-weighted-cap0_75.txt"

G = nx.DiGraph()

with open(ppi_file, "r") as file:
    next(file)

    for line in file:
        tail, head, edge_weight, edge_type = line.strip().split("\t")
        G.add_edge(tail, head, edge_weight=float(edge_weight), edge_type=edge_type)

pos = graphviz_layout(G)

plt.figure(figsize=(150, 150))  # Adjust the figure size as needed
nx.draw_networkx_nodes(G, pos,node_size=3000)
nx.draw_networkx_labels(G, pos)
nx.draw_networkx_edges(G, pos, arrows=False)

# Save the plot as an image file

plt.savefig("ppi_network.png", dpi=300)  # Adjust the dpi (dots per inch) as needed

plt.show()
The output is this image:
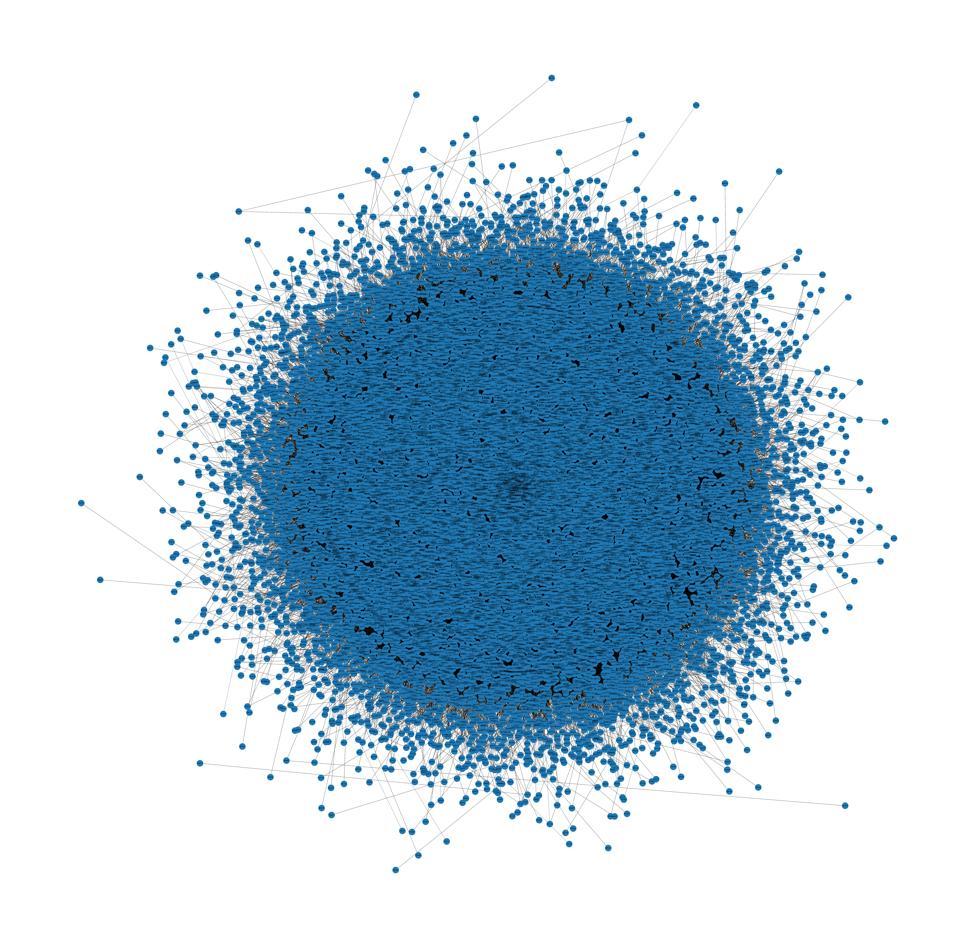
I have tried increasing the dimensions of the figure, using the graphviz layout, and adjusting the dpi, but the output is still crammed together. How can I make the network clearer and not stacked on top of one another?
To make the network clearer and avoid nodes being stacked on top of one another, you can try the following modifications to your code:
- Increase the dimensions of the figure even more to provide more space for the network visualization. You can modify the figsize parameter in the plt.figure() function.
plt.figure(figsize=(200, 200)) # Adjust the figure size as needed
- Adjust the node size to make them smaller, allowing more space for the network to spread out. You can modify the node_size parameter in the nx.draw_networkx_nodes() function.
nx.draw_networkx_nodes(G, pos, node_size=500)
- Use a different layout algorithm instead of graphviz_layout(). NetworkX provides alternative layout algorithms that you can try, such as spring_layout() or circular_layout(). You can replace the pos = graphviz_layout(G) line with a different layout function.
pos = nx.spring_layout(G)
- Increase the dpi (dots per inch) even more when saving the plot as an image file to ensure a higher resolution. You can modify the dpi parameter in the plt.savefig() function.
plt.savefig("ppi_network.png", dpi=600) # Adjust the dpi as needed
By applying these modifications, you should be able to create a clearer network visualization that is not stacked on top of one another.
